

Understanding Polysome-seq data
Introduction
Insight into translational efficiency Polysome profiling allows monitoring of mRNA translation activity using sucrose gradient fractionation. The sequencing of the collected polysome fractions offers two key advantages over Ribo-seq: (1) it enables the quantification of the exact number of ribosomes per mRNA, and (2) the longer reads of polysome-seq allow for more accurate mapping and hence better isoform delineation which is very challenging using 30-nt ribosome footprints1.

Figure 1 On the EIRNA Bio Connect platform Polysome fraction indexes for control and treated Hek293 cells (sodium arsenite). Each heatmap corresponds to a condition; each column is a polysome fraction, in this case light fraction LHS and heavy fraction RHS; and each row corresponds to a transcript.
Polysomes:Monosomes ratio of mRNA
Polysome-seq data can provide biological insights into differences in translational efficiency between conditions. The standard experimental design is collecting and sequencing 2 or more fractions, for instance, light (monosome, disome and trisome) and heavy fractions (polysomes) with multiple replicates for each condition. It is generally accepted that mRNAs associated with >3 ribosomes (heavy polysome fraction) represent more efficiently translated mRNAs, while mRNAs associated with the light fraction would be considered poorly translated. When an mRNA is highly translated, it typically means that the ratio of polysomes to monosomes is high. This indicates that multiple ribosomes are attached to and translating the mRNA, reflecting high translation efficiency. By comparing the abundance of a transcript in each fraction between conditions, it can be elucidated if a treatment induces global translational up- or down-regulation.
The EIRNA Bio Connect Approach: Polysome shift score
To assess which mRNAs undergo shifts in polysome fractions upon treatment we developed the EIRNA Bio Connect functionality polysome shift score. Our approach calculates and visualises two metrics: Polysome Fraction Index (PFI) and Polysome Shift Ratio (PSR). Polysome Fraction Index measures the proportion of each transcript that is present in the different polysomal fractions and is calculated for each of the 2 conditions (Figure 1). Polysome Shift Ratio summarises the differences between conditions into log ratios of PFIs (Figure 2).
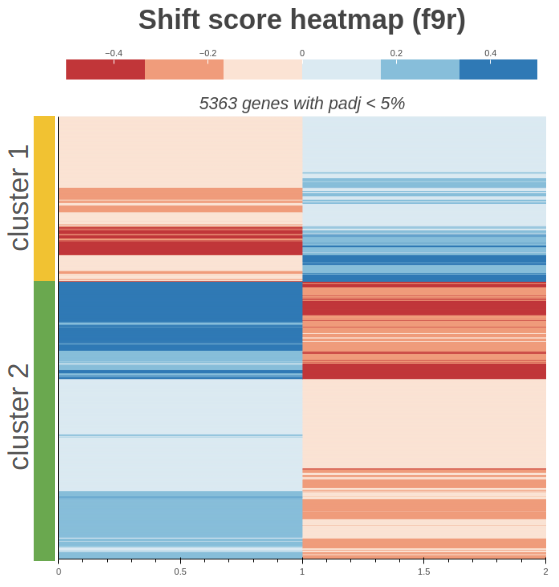
Figure 2. Polysome Shift Ratio Heatmap for transcripts with significant shifts between polysome fractions when samples treated with sodium arsenite are compared to control samples.
Applications and Implications
Exemplified using EIRNA Bio’s high-quality data, both Figure 1 and Figure 2 show that the oxidative stress treatment leads to a shift of most mRNAs towards the lighter fraction which can be interpreted as general translational repression. However, there is a proportion of mRNAs following the opposite trend – they move from the light fraction in the control samples to the heavy fraction in the treated samples suggesting that they are translationally upregulated in order to counteract the changes caused by the treatment. Those 2 clusters can be clearly seen on Figure 2.
In the smaller cluster (cluster 1), where mRNAs shift towards the heavy fraction in treated samples, known RNAs such as ATF4, ATF5, PPP1R15A are upregulated upon arsenite treatment. This finding validates discoveries from Andreev and O’Connor et al., 20152.
Learn how EIRNA Bio Connect can provide actionable insights for your own data.
Over the course of the coming months, we will highlight additional EIRNA Bio Connect functionality to illustrate how our interactive platform can help advance your own research questions.
1. Bicknell AA, Reid DW, Licata MC, Jones AK, Cheng YM, Li M, Hsiao CJ, Pepin CS, Metkar M, Levdansky Y, Fritz BR, Andrianova EA, Jain R, Valkov E, Köhrer C, Moore MJ. Attenuating ribosome load improves protein output from mRNA by limiting translation-dependent mRNA decay. Cell Rep 2024 Apr 23;43(4):114098. doi: 10.1016/j.celrep.2024.114098.
Andreev DE, O’Connor PBF, Fahey C, Kenny EM, Terenin IM, Dmitriev SE, Cormican P, Morris DW, Shatsky IN, Baranov PV (2015) Translation of 5′ leaders is pervasive in genes resistant to eIF2 repression. Elife Jan 26:4:e03971.