
Understanding differential distribution of ribosomes across mRNA
What is RNA-seq based differential gene expression’s (DGE) blind spot?
RNA-seq is a powerful and widely employed tool to quantify gene expression at the RNA level. However, that there are several limitations when using RNA-seq only derived gene expression counts to predict differential gene expression (DGE) across different treatments or conditions. The primary blind spot of DGE analysis is that it focuses on mRNA abundance rather than protein synthesis or functional output. As such translational regulation is overlooked:
- DGE assumes that changes in mRNA levels correlate with protein abundance, but translation efficiency varies widely between genes.
- Ribosome pausing, non-AUG translation initiation bias, and regulatory RNA elements (e.g., upstream ORFs) can significantly impact how much protein is produced from a given mRNA.
EIRNA Bio does things differently by using ribosome profiling (Ribo-seq) to address the limitations of RNA-seq for DGE analysis (see post about EIRNA Bio Connect’s approach for incorporating Ribo-seq along with RNA-seq for more complete DGE analysis).
However, in addition to leveraging the translation efficiency information derived from Ribo-seq, the information of where ribosomes are exactly positioned on mRNA and their density is very powerful. For instance, Lintner et al., (2017)1 used this unique property of Ribo-seq to uncover the mechanism of action of the small molecule PF-06446846, which selectively inhibits the translation of human PCSK9, a key regulator of LDL cholesterol levels (Figure 1).

Figure 1 Ribosome profiling comparison plots as implemented on the Connect platform enabling easy discernment of changes in ribosome density and distribution on the same mRNA for 2 or more treatment conditions. Here the Ribo-seq profiles for the PCSK9 mRNA are visualised under control (green trace) and treatment with the small molecule PF-06446846 (red trace). The Ribo-seq data is from Lintner et al., (2017)1
Understanding differential distribution of ribosomes across mRNA
As reported by Lintner et al., (2017) ribosome profiling revealed that PF-06446846 induces selective ribosomal stalling at codon 34 of the PCSK9 transcript (see differential peak of high density at CDS codon 34 in Figure 1). This stalling occurs due to interactions between the drug and the nascent peptide chain inside the ribosome exit tunnel, preventing full-length protein synthesis. As well as the high-density peak representing stalled ribosomes, the region downstream of the stall is depleted of ribosomes compared to the same mRNA region under control conditions. Overall, there is a clear difference in the distribution of ribosomes between the two conditions.

The EIRNA Bio Connect Approach: Differential Silhouette
Lintner et al., reported that Ribo-seq demonstrated the high selectivity of PF-06446846 in inhibiting the translation of PCSK9, with minimal off-target effects. How to find similar cases across the transcriptome? EIRNA Bio Connect’s functionality for predicting mRNAs with a differential distribution of ribosomes under different conditions is called Differential Silhouette (DS) (Figure 2). In essence, the DS algorithm predicts mRNAs where the shape of their ribosome density profile has changed. This method provides a more nuanced understanding of translational control mechanisms, as it considers the positional information of ribosomes on transcripts rather than just overall translation levels.

Figure 2 Differential Silhouette plot showing the genes (green, blue and red) that are predicted to have a different ribosome profile outline (silhouette) when treated with PF-06446846 compared to control. For more detailed explanation of the D-Max and D-corr algorithms, request access to EIRNA Bio Connect.
Applications and Implications
The EIRNA Bio Connect browser-based platform contains a tool for the identification of differential CDS/Leader counts between two groups using Ribo-seq counts. The user selects the samples of interest to belong to each group and chooses whether or not to include ambiguously mapped reads in the analysis.
Applications and Implications
While most differential comparisons across treatment conditions focus on differences in mRNA abundance levels, on EIRNA Bio Connect we provide several algorithms that leverage Ribo-seq’s unique properties. While differential gene expression analysis is very useful, it relies on the assumption that the number of aligned reads is directly correlated with protein synthesis. However, ribosome pausing may also occurs which can also result in differences of aligned reads. One such example is the RPL27 mRNA which is not predicted as DE using Ribo-seq counts, yet it is predicted as DS (Figure 3). The comparative mRNA profiles of RPL27 mRNA show a very strong differential silhouette upon PF-06446846 treatment compared to Vehicle (Figure 4). Relying on differential gene expression analysis only would have incorrectly predicted that the RPL27 mRNA was not impacted by the PF-06446846 treatment.

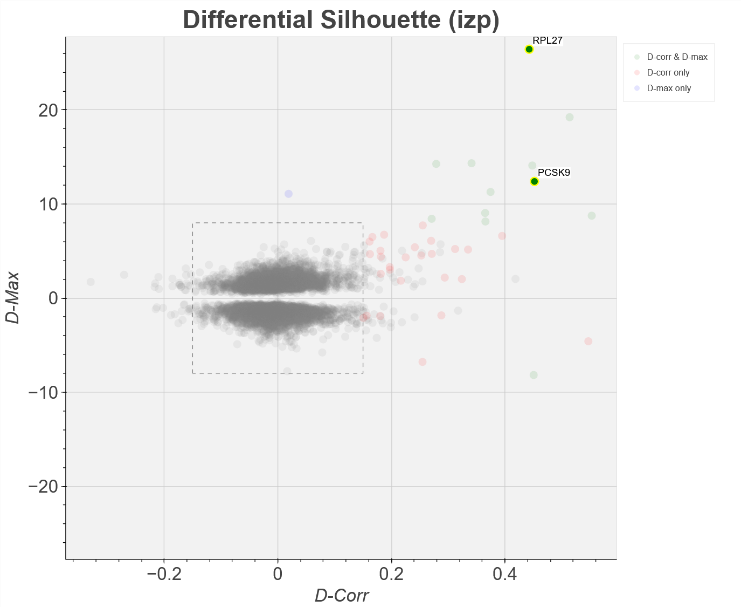
Figure 3 LHS Volcano plot using Ribo-seq gene expression counts from Lintner et al., (2017) data. Unlike the PCSK9 gene, the RPL27 gene is not predicted to be differentially expressed upon treatment with the small molecule PF-06446846 compared to the control. RHS Differential Silhouette prediction using Lintner et al., (2017) data shows that RPL27 is predicted as having a significantly different ribosome distribution across its mRNA upon PF-06446846 compared to the control.

Figure 4 Ribosome profiling comparison plots as implemented on the Connect platform for the RPL27 mRNA. The green trace represents the ribosome silhouette under Vehicle and the red trace represents the ribosome silhouette under treatment with the small molecule PF-06446846.1
Challenges and Future Directions
Relying on gene expression counts only can result in incorrect interpretation and false negative predictions. EIRNA Bio Connect is a unique browser-based platform that enables combined Ribo-seq and RNA-seq DE analysis as well as Differential Silhouette (DS) analysis at the click of a button without the need for prior bioinformatic experience. Using both algorithms provides a better understanding of what’s happening at the level of the transcriptome and the translatome, Lintner et al. demonstrated small molecules can specifically inhibit translation of a single disease-associated protein by stalling the ribosome’s nascent chain opening up a new therapeutic strategy for ‘undruggable’ proteins1,2. As well as drug-induced ribosome stalling, specific stalling events are linked to distinct pathological conditions, highlighting the importance of understanding ribosome dynamics in disease contexts3.
Conclusion
1. Lintner NG, McClure KF, Petersen D, Londregan AT, Piotrowski DW, Wei L, Xiao J, Bolt M, Loria PM, Maguire B, Geoghegan KF, Huang A, Rolph T, Liras S, Doudna JA, Dullea RG, Cate JHD. Selective stalling of human translation through small-molecule engagement of the ribosome nascent chain. PLoS Biol. 2017 Mar 21;15(3):e2001882. doi: 10.1371/journal.pbio.2001882.
2. Disney MD. Inhibiting Translation One Protein at a Time. Trends Biochem Sci. 2017 Jun;42(6):412-413. doi: 10.1016/j.tibs.2017.04.008.
3. Veltri AJ, D’Orazio KN, Lessen LN, Loll-Krippleber R, Brown GW, Green R. Distinct elongation stalls during translation are linked with distinct pathways for mRNA degradation. Elife. 2022 Jul 27:11:e76038. doi: 10.7554/eLife.76038.
- 1. Lintner NG, McClure KF, Petersen D, Londregan AT, Piotrowski DW, Wei L, Xiao J, Bolt M, Loria PM, Maguire B, Geoghegan KF, Huang A, Rolph T, Liras S, Doudna JA, Dullea RG, Cate JHD. Selective stalling of human translation through small-molecule engagement of the ribosome nascent chain. PLoS Biol. 2017 Mar 21;15(3):e2001882. doi: 10.1371/journal.pbio.2001882.
- Disney MD. Inhibiting Translation One Protein at a Time. Trends Biochem Sci. 2017 Jun;42(6):412-413. doi: 10.1016/j.tibs.2017.04.008.
- Veltri AJ, D’Orazio KN, Lessen LN, Loll-Krippleber R, Brown GW, Green R. Distinct elongation stalls during translation are linked with distinct pathways for mRNA degradation. Elife. 2022 Jul 27:11:e76038. doi: 10.7554/eLife.76038.

